
When you are preparing for your PMI-ACP exam, studying formulas has probably not been your top priority so far. Although the PMI-ACP exam puts less emphasis on calculations than other certifications (such as the PMP, for instance) you should be familiar with a few formulas. As they are not overly complicated, they are ‘quick wins’ in your PMI-ACP exam.
Relevance of Formulas in the PMI-ACP Exam
The PMI does not publish the detailed requirements for its exams, so there is no official list of all indicators and calculations relevant for the exam. However, the ‘PMI Agile Certified Practitioner (PMI-ACP®) Examination Content Outline’ (you will find it on the PMI website in case you haven’t downloaded it yet) lists a number of tools and techniques as well as knowledge and skills. This list contains a number of hints on which formulas are required for the exam.
You can use this summary to learn and memorize the formulas and their meanings. Follow the links to articles where we introduce some indicators in more detail and provide examples that will help you understand their uses.
The formulas are stemming from PMI’s Agile Practice Guide which can be found on the PMI website.
Metrics for Agile Projects
This section summarizes the metrics relevant for the PMI-ACP exam and their formulas. Read this guide for more background on agile projects and their tools and techniques.
Productivity
Velocity
The story points of completed items in an iteration.
Velocity = sum of story points of completed items / iteration
It can be calculated for a single iteration but is often calculated as an average value of several iterations:
Average velocity = sum of story points of completed items from n iterations / n
Throughput
Throughput is a measure of the number of work items completed during an iteration or another period of time.
Defect rate
There are several approaches to measuring the defect rate while the PMI Practice Guide does not provide a precise definition or formula of this indicator. However, the generic formula is
Defect rate = Number of defects / number of items,
whereby the number of items depends on whether it is based on a sample or a full set of items.
Work in progress
This section contains several indicators that measure the progress of work in an iteration based on story points, duration and number of features.
Story Points Remaining
Story points remaining is an indicator that shows how many story points are not yet completed during an iteration.
Story points remaining = story points planned for an iteration – story points of already completed items
This indicator can be calculated at any given point in time during an iteration. It is typically presented as a line in a burndown chart.
Story Points Done
The number of story points of completed items at a point in time during an iteration.
Story points done = sum of story points of completed items
This number can be determined at any given point in time during an iteration. It is often shown as a line in a burnup chart.
Lead Time
Lead time measures the duration for delivering an item.
Lead time = time of completion – time of adding an item to the board
Board refers to a Kanban board or similar tools and techniques. The measurement of the lead time begins when an item is added to the “ready” column of that board. Lead time is also equal to the sum of cycle time and response time.
Cycle Time
Cycle time measures the processing time of an item.
Cycle time = time of completion – time of starting the task
The starting point of the cycle time is the point when the task is drawn from the “ready” column of a (Kanban) board.
Response Time
Response time is the time an item is idling in the “ready” column of a board until the work is started.
Response time = time of starting the task – time of adding the item to the board
Completed Work
The completed work indicator measures the number of features that have been completed
Completed work = number of features completed
Remaining Work
Remaining work is the number of features that have been completed
Remaining work = number of features that have not (yet) been completed
Work in Queue
Work in queue refers to the number of features that are waiting to be processed.
Work in queue = number of features for which work has not (yet) started
Earned Value Management (EVM) for Agile Projects
Earned value management is a broad and important concept in traditional project management that has been downsized and adapted for use in agile projects.
Definition of Components
Earned Value (EV) = The portion of the approved budget (or story points) that are allocated to a completed item.
Planned Value (PV) = The (budget / story point) value of items that were planned to be completed at a point in time.
Actual Cost (AC) = The amount of cost consumed at a point in time
Cost Variance (CV)
Cost variance is the difference between the earned value and the actual cost at a point in time:
Cost variance (CV) = EV – AC
Cost Performance Index (CPI)
The cost performance index expresses the earned value divided by the actual cost:
Cost performance index (CPI) = EV / AC
A value of 1 indicates that the earned value is in line with the planned cost. A value greater than 1 indicates that the project operates at lower cost than initially planned while values smaller than 1 show the opposite.
Schedule Variance (SV)
Schedule variance is the difference between earned value and planned value:
Schedule variance (SV) = EV – PV
Schedule Performance Index (SPI)
The schedule performance index is a relative expression of the schedule variance:
Schedule performance index (SPI) = EV / PV
A value of 1 shows that the project operates in line with the planned schedule. If the SPI exceeds 1, the project is ahead of the plan while a value below 1 indicates that it is behind the schedule.
Value-Based Prioritization
Return on Investment (ROI)
This return on investment sets the returns of an investment in relation to the investment amount. It is calculated as:
Return on investment (ROI) = (Return – Cost – Investment) / Investment.
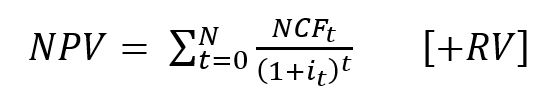
Net Present Value (NPV)
The net present value is the sum of discounted net cash flows. It is calculated as:
Internal Rate of Return (IRR)
The internal rate of return is the discount rate for which the present value (= sum of discounted cash flows) equals 0.
It is usually iteratively determined and there is no simple formula. Thus, the exam will focus on the understanding of the concept rather than require the IRR calculation.
Other Indicators
Although not explicitly mentioned in the exam scope, taking a look at the other indicators of cost-benefit analysis may be useful.
Conclusion
Note that the PMI calls its list of tools and techniques non-exhaustive and begins every section with “including but not limited to”. Subsequently, this summary cannot be exhaustive either. However, it provides you with a comprehensive overview of many or most formulas that are relevant for the PMI-ACP exam. Use it as a “cheat sheet” to memorize these calculations and test your knowledge.
Visit our section on Agile Projects and Scrum to find more material that will help you prepare for your exam.