

When you prepare a project in line with PMI or other established project management methodologies, you will have to create a project business case. This business case is usually a study on the expected qualitative and financial benefits of a single project or different project options. An essential part of this process is the cost-benefit analysis (sometimes also called benefit-cost analysis).
- What Is a Project Business Case?
- What Is a Cost-Benefit Analysis?
- What Are Common Tools and Techniques of a Cost-Benefit Analysis?
- How to Do a Cost-Benefit Analysis in 7 Steps
- Step 1) Define the Scope and Purpose of a Cost-benefit Analysis
- Step 2) Define the Fundamental Assumptions
- Step 3) Determine the Qualitative Advantages and Disadvantages of a Project or Investment Option
- Step 4) Develop a Forecast of Investments, Costs and Benefits
- Step 5) Choose the Methods to Assess a Project Option (e.g. NPV, BCR, IRR)
- Step 6) Calculate the Value of the Success Measures
- Step 7) Consolidate, Compare and Interpret the Results
- Example: Assessing Project Options with NPV, BCR and PbP
- Conclusion
What Is a Project Business Case?
Before a project is initiated, the potential benefits need to be analyzed in a project business case. This document is also the basis for stakeholder decisions and the selection of project options.
The Project Management Institute (PMBOK®, 6th ed., part 1, p. 30) defines the business case as a ‘documented economic feasibility study’ that outlines the business needs, the current situation, an economic analysis and recommendations. In practice, the structure of business case documents is typically tailored to the requirements and expectations of the stakeholders and the organization. In order to evaluate the economic effects of a project and make different project options comparable, project managers leverage the tools and techniques of the cost-benefit analysis (see next section).

A business case is often accompanied by a benefits management plan (which is also suggested by the PMBOK). This document sets out how the project is going to ensure that the expected benefits will eventually materialize in reality. Both the business case and the benefits management plan are the foundation and input documents of the project charter which is the formal documented authorization and mandate for the initiation of a project.
What Is a Cost-Benefit Analysis?
A cost-benefit analysis is an economic evaluation of investment alternatives and project options with respect to their profitability and liquidity effects. It can also consider non-financial and qualitative aspects which however may or may not be reflected in the forecast of cost and benefits.
Besides forecasting investments, cost and benefits over an individually defined time horizon, a cost-benefit analysis usually involves a number of indicators. These measures aggregate forecasts and assumptions into catchy numbers that can be used for comparison and communication purposes.
Discounting cash flows, determining the amortization time, and calculating return rates are the most common approaches for calculating key performance indicators of a forecast in a cost-benefit analysis. We will cover these approaches in detail in the next section.
What Is a Cost-Benefit Analysis Used For?
There are several reasons for using a cost-benefit analysis. The most obvious one is to determine the expected financial returns and profitability of an investment or a project. Subsequently, different options can be compared with each other based on cost-benefit analyses. This can be the basis for decision-making and the selection of the alternative or option to go for (source). This is a typical step before project initiation and often part of a project business case.
The initial cost-benefit analysis results also serve as a baseline for the measurement of success in an ongoing project. Thus, they help project managers, sponsors and other stakeholders to measure, monitor and manage the value a project is creating against the original expectation.
Although the cost-benefit analysis is not an original risk management technique, its results can be used to assess and consider certain risks of a project. An example is a benefit-cost ratio greater than 1: the closer it gets to 1, the higher the risk that even small deviations from the forecasted benefits lead to a loss-producing project.
On the other side, discounted cash flow-based approaches can be calculated using a risk-adjusted discount rate. This allows taking inherent risk into account when net present values or benefit-cost ratios are calculated.
What Are Common Tools and Techniques of a Cost-Benefit Analysis?
An inevitable part of a project business case and a cost-benefit analysis are certain success measures. While the set of indicators needs to be in line with the organization’s requirements, there are in fact a number of very common indicators that are introduced below. Although the following list is not exhaustive, it covers the generic types of the most common success measures, namely:
- Net present value (NPV),
- Benefit-cost ratio (BCR),
- Payback period (PBP or PbP),
- Return on investment (ROI),
- Internal rate of return (IRR).
These success measures allow project managers to conduct a balanced cost-benefit analysis that covers different aspects such as profitability, liquidity and riskiness of project options. At the same time, these indicators are comparatively simple to calculate and easy to understand in the course of stakeholder communication.
Net Present Value (NPV)
The NPV represents the present value of a series of cash flows. The calculation involves the discounting of net cash flows with a discount rate. This rate is part of the set of assumptions required for applying the net present value method.
The underlying series of cash flows begins with the initial investment as an outflow, followed by net cash flows for each period of the time horizon of the forecast. Future cash flows and a remaining value (or salvage value), as well as disposal costs or further returns expected in subsequent periods, are reflected in a residual value.
Read more in our article on the net present value and use our NPV calculator to determine the value of your project options and investment alternatives.
Benefit-Cost Ratio (BCR)
The benefit-cost ratio compares the present values of all benefits with the present value of all costs expected in a project or investment. A value greater than 1 indicates a profitable project with a total return exceeding the discount rate. A value of less than 1 suggests that the forecasted series of cash flows is not a profitable option.
Read more in our article on the benefit-cost ratio and use our BCR calculator to determine the value of your project options and investment alternatives.
Payback Period (PBP / PbP)
The payback period determines the period in which the cumulative cash flows of a project turn positive for the first time. At that point, the initial investment has been ‘paid back’.
The series of cash flows usually starts with an investment (an outflow, hence a negative number), followed by positive and/or negative net cash flows. These can be even, i.e. the net cash flow remains constant for the entire forecast horizon, or uneven with different values among the periods of a forecast.
When determining the payback period, the generic approach does not use any discount rates or other adjustments which may be inaccurate for long-term forecasts. However, there are a number of modified PbP approaches that can be used to resolve this disadvantage.
Read more in our article on the payback period and use our PbP calculator to determine the value of your project options and investment alternatives.
Return on Investment (ROI)
The basic formula of the ROI is a division of expected constant returns by the investment amount. It is usually calculated for only one period. However, there are several variants of the return on investment method, including a cumulative and annualized ROI (for multiple periods).
Internal Rate of Return (IRR)
The internal rate of return is determined by using a net present value calculation. The IRR is the discount rate that would lead to an NPV of 0 if applied to the individual forecast. The resulting rate is the fictive interest or return rate of an investment.
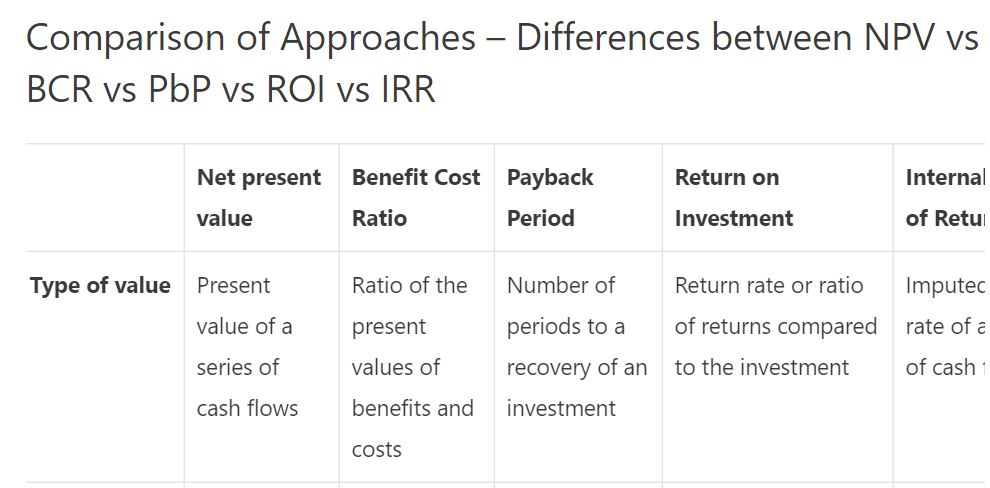
Comparison of Approaches – Differences between NPV vs BCR vs PbP vs ROI vs IRR
| Net present value | Benefit Cost Ratio | Payback Period | Return on Investment | Internal Rate of Return | |
| Type of value | Present value of a series of cash flows | Ratio of the present values of benefits and costs | Number of periods to a recovery of an investment | Return rate or ratio of returns compared to the investment | Imputed return rate of a series of cash flows |
| Calculation approach | Sum of discounted cash flows | Dividing discounted benefit cash flows by discounted cost cash flows | For even cash flows: investment divided by cash flow; for uneven cash flows: formula applied in the first period of positive cumulated cash flow | Basic calculation: return divided by investment. There are further approaches that also consider periodicity of cash flows | Searching the value of the unknown discount rate in a series of cash flows for a given NPV of 0 |
| Business dimension | Profitability | Profitability and Riskiness | Liquidity | Profitability | Profitability |
| Input parameters | Initial investment, cash flow projection for each period, residual value at the end of the forecast (if applicable), discount rate | Initial investment, gross inflows and outflows for each period, residual value (if applicable), discount rate | Initial investment, cash flow projection | Initial investments, returns (i.e. benefits) and costs | Initial investment, cash flow projection for each period, residual value at the end of the forecast (if applicable) |
| Main advantages | Considers the value of cash flows in relation to the discount rate (i.e. expected return rate), thus taking the point in time of their occurrence into account | Provides an assessment of whether and to which extent benefits exceed the cost and investments. Thus, it also measures how much ‘buffer’ exists for risks to the inflows | Comparatively easy to calculate; provides an assessment of liquidity aspects of a project, i.e. of how long cash is tied up | Very common key performance indicator with a rate or ratio as a catchy result type | Aggregates profitability into one single number that reflects the periodicity and allows for comparisons with financial investments |
| Main disadvantage | Relies considerably on several assumptions; Considers the profitability only, without taking liquidity and funding aspects into account | Relies considerably on several assumptions; considering the point in time of inflows and outflows only through discounting but not with respect to the availability or re-investment of liquidity | Inherent insecurity of cash flow prediction; no discounting, hence value of money over time not considered (discounted payback period resolves this disadvantage) | Periodicity not taken into account in the original formula; although the indicator is well-known, calculation approaches may vary (e.g. exclusion of certain cost types) | Implicit assumption that net inflows could be re-invested at the IRR; methodological weaknesses of NPV |
| Further information | Article on NPV; NPV Calculator | Article on BCR; BCR Calculator | Article on PbP incl. Calculator | Article on single- und multiple period ROI incl. calculator; Projectmanager.com | Article on IRR, its calculation and pros and cons; IRR Calculator; Wikipedia |
How to Do a Cost-Benefit Analysis in 7 Steps
Follow these 7 steps to prepare a cost-benefit analysis. You will need some input data, as set out in the individual steps, a calculator and a fundamental understanding of the aforementioned indicators. You can download this checklist which will help you gather the required information and data.
The following steps refer to both the qualitative and the financial aspects of a cost-benefit analysis.
Step 1) Define the Scope and Purpose of a Cost-benefit Analysis
First things first: before you start assessing different project options or investment alternatives, make sure that you develop and agree on a clear definition of the scope and purpose of the analysis.

The scope describes what exactly you are going to evaluate. This may refer to high-level project options, single investments or other types of endeavors that are selected for the analysis. For a proper cost-benefit analysis, it should be clear which components are expected to be included (e.g. indirect / internal costs and benefits) and which are not (e.g. direct or indirect taxes).
Determining the purpose of the analysis relates to the expected result type. It clarifies whether solely economic aspects are to be considered, or whether qualitative criteria are also relevant and part of this analysis. A project manager should also be aware of whether profitability, liquidity or risk is the organization’s most relevant consideration.
Examples of cost-benefit analyses that may not solely focus on economic criteria are non-profit projects or social projects run by governments or NGOs.
Step 2) Define the Fundamental Assumptions
Before you start, make sure that the basic assumptions of the analysis are known and will be considered in subsequent steps. Assumptions may range from implementation scenarios, headcount, resource needs, etc. to agreed expectations regarding the discount rate and the organization’s target profitability.
Make sure that you are incorporating and addressing all the criteria deemed important by the organization. If you compare different project options, it is crucial that the assumptions are used consistently among all the alternatives you are comparing.
If different or even contradicting types of assumptions are requested, you should consider assessing them separately and in different scenarios.
Step 3) Determine the Qualitative Advantages and Disadvantages of a Project or Investment Option
Gather and document the pros and cons of each and every option you are assessing. Group them into categories and compare them among each other, e.g. in a structure similar to our table in the previous section.

Depending on the type of project, you may wish to consider converting qualitative aspects into financial benefits or cash flow equivalents. This could be done for qualitative advantages that are indirectly affecting financial cash flows. Examples are increasing process efficiency, customer satisfaction and engagement as well as improved quality of products and services.
This may however not be working for other types of advantages and disadvantages. For instance, social and ecological considerations (source) as well as long-time effects such as brand image may not be convertible into cash flows of a mid-term forecast.
Step 4) Develop a Forecast of Investments, Costs and Benefits
Come up with a forecast of future benefits and costs (or cash inflows and outflows), investment amounts and other financial considerations.
Depending on the complexity of the options that you are analyzing, you may want to involve subject matter experts to create or validate estimates.
This step usually requires a number of assumptions on a granular level. You should therefore develop an understanding of the uncertainty inherent in this forecast. If you are in doubt, you better create different scenarios (e.g. a base and a worst case) to reflect situations where things turn out differently than expected.
Step 5) Choose the Methods to Assess a Project Option (e.g. NPV, BCR, IRR)
A cost benefit analysis can be performed with different tools and techniques. Net present value, benefit-cost ratio, payback period, return on investment and internal rate of return are the most common methods to assess economic effects from projects, investments and initiatives. Refer to the above-mentioned introduction and read the detailed articles on these measures. Eventually, you will come up with a set of indicators that is suitable for the individual situation.
Step 6) Calculate the Value of the Success Measures
If you have selected the indicators, you need to apply them to the forecasts that you have developed in a previous step. You will find the formulas in the detailed articles on those methods. When calculating the success measures, apply every method in a consistent manner to all options. This will ensure the comparability and thus the integrity of the results.

Step 7) Consolidate, Compare and Interpret the Results
As a last step, consolidate all the aspects and results that you have produced in the course of the analysis. You can do this by creating a table that contains the calculated values, the qualitative pros and cons and a ranking of each of the options.
If you are working in scenarios, you will probably want to breakdown each option into the different scenarios (e.g. best, middle, worst case) that you have used previously.
At the completion of the cost-benefit analysis, you should have a clear view on the economic and qualitative aspects of the alternatives you are comparing. Ideally, you are able to recommend a certain option or discard others at this point.
Example: Assessing Project Options with NPV, BCR and PbP
In this illustrative example, we will compare 3 different project options for the implementation of a new IT system with each other. For illustrative purposes, the analysis focuses on the economic aspects only, not taking qualitative and strategic considerations into account.
Forecast of Cash Flows
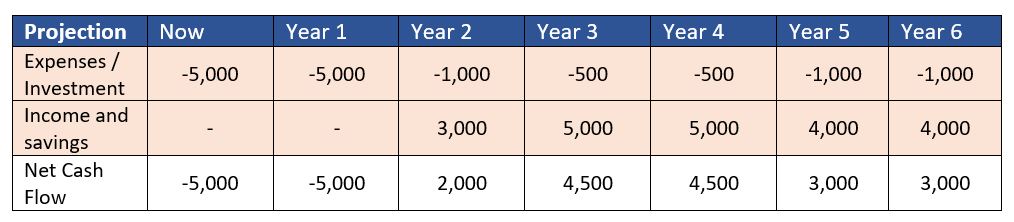
In order to perform the cost-benefit analysis with all three options, the project manager has obtained estimates of the investments, running and maintenance costs and expected benefits. The benefits consist of both savings from more efficient processes and increased revenue given that the new software improves the way customers are served. The following table shows the consolidated forecast of the three alternatives.
| Option 1 | Now | Year 1 | Year 2 | Year 3 | Year 4 | Year 5 | Year 6 |
| Investment & Costs | -5,000 | -5,000 | -1,000 | -500 | -500 | -1,000 | -1,000 |
| Benefits | – | – | 3,000 | 5,000 | 5,000 | 4,000 | 4,000 |
| Net Cash Flow | -5,000 | -5,000 | 2,000 | 4,500 | 4,500 | 3,000 | 3,000 |
| Option 2 | Now | Year 1 | Year 2 | Year 3 | Year 4 | Year 5 | Year 6 |
| Investment & Costs | -15,000 | -1,000 | -1,000 | -1,000 | -500 | -500 | -1,000 |
| Benefits | – | 2,500 | 5,000 | 5,000 | 5,000 | 5,000 | 5,000 |
| Net Cash Flow | -15,000 | 1,500 | 4,000 | 4,000 | 4,500 | 4,500 | 4,000 |
| Option 3 | Now | Year 1 | Year 2 | Year 3 | Year 4 | Year 5 | Year 6 |
| Investment & Costs | -3,000 | -3,000 | -2,500 | -1,000 | -500 | -500 | -500 |
| Benefits | – | – | 3,000 | 4,000 | 4,000 | 3,000 | 3,000 |
| Net Cash Flow | -3,000 | -3,000 | 500 | 3,000 | 3,500 | 2,500 | 2,500 |
One could be tempted to simply calculate the sum of the cash flows. However, this is not an accurate approach to deal with cash flows occurring at different points in time. We will nevertheless use the simple sum in the result table for comparison purposes.
Determination of the Discount Rate
If one of the more accurate approaches such as NPV and BCR are used, a discount rate is necessary to perform the calculation. This discount rate can be a market interest rate which may be risk- or time-adjusted. In organizations and projects, more common alternatives are either the company’s target return rate or the cost of capital. In this example, the organization expects a return of 12% on all investments which will be used as a discount rate accordingly.
Comparison of NPV, BCR, PBP, ROI and IRR Results
The following table compares the results of the different methods applied to this example. Refer to the dedicated articles on each of these indicators for the respective illustrated step-by-step calculation.
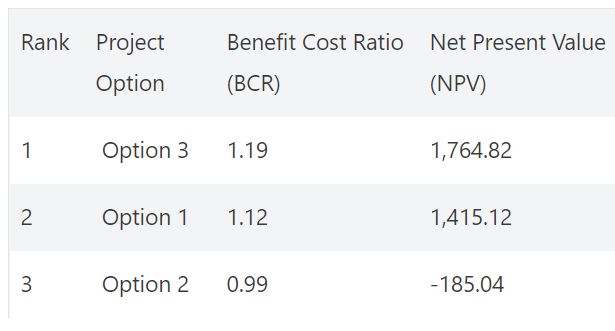
| Rank | Project Option | Benefit Cost Ratio (BCR) | Net Present Value (NPV) | Payback Period (PbP) | Return on Investment (ROI) | Internal Rate of Return (IRR) | Sum of Cash Flows |
| 1 | Option 3 | 1.19 | 1,764.82 | 4.71 | 75.00% (annualized: 9.78%) | 20.68% | 6,000 |
| 2 | Option 1 | 1.12 | 1,415.12 | 4.77 | 77.78% (annualized: 10.06%) | 16.76% | 7,000 |
| 3 | Option 2 | 0.99 | -185.04 | 5.22 | 50.00% (annualized: 6.99%) | 11.61% | 7,500 |
Based on the economic cost-benefit analysis, Option 3 seems to be the most promising one in all measures except ROI. Although the simple sum of its net cash flows is the lowest in this comparison, it creates the highest net present value and the highest internal rate of return. This is because the period when expenses and benefits occur is considered in the NPV. It also comes with the highest benefit-cost ratio. Thus, there is a certain buffer if the benefits do not materialize in the way it was initially expected. With a payback period of 4.71, this option achieves a full amortization in less than 5 years which can be a reasonable time horizon for many organizations.
Option 2 which has the highest sum of non-discounted cash flows does in fact not even yield the required return rate of 12%. As this rate has been used as a discount rate, both the BCR and the NPV indicate a non-profitable investment.
Note that the ROI, as well as the annualized ROI, are not accurate for these examples. Refer to the detailed ROI calculation for further explanations. We have not included the Disconted Payback Period (DPP) as it is not mentioned in the PMBOK. You can find the DPP for the above case study in this article though.
This example refers to the economic aspects of a cost-benefit analysis. In practice, you would want to consider and analyze the qualitative pros and cons as well.
Conclusion
A proper project business case usually requires a financial cost-benefit analysis. While there are a number of calculation methods that help compare and evaluate different project options, you should be aware of the risks and weaknesses (source).
Financial models and indicators are always an abstraction of the reality and forecasts may or may not be met in reality. Therefore, all the methods introduced above rely on assumptions. In some cases, it may even be only one single figure turning it into a loss-producing or profitable option (e.g. a perpetuity in the NPV).
So, make sure you understand these dependencies, work with different scenarios if sensible and maintain a comprehensive and honest communication with the stakeholders. Read our detailed articles on cost-benefit analysis methods to learn more about these methods and use this checklist when doing a cost-benefit analysis.