
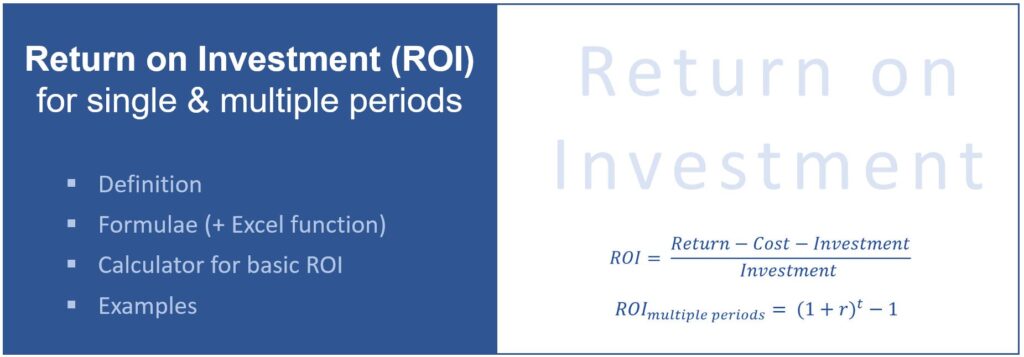
Return on Investment is one of the most common indicators used for the cost-benefit analysis. This is probably because of its simplicity and understandability of the information conveyed. In Project Management, it is a success measure suggested by the Project Management Institute (PMI; source: PMBOK®, 6th ed., part 1, ch. 1.2.6.4, p. 34). However, the basic ROI has some limitations, e.g. if you need to compare alternatives with different tenors.
In this article, we will introduce the fundamental concept of return on investment measurement as well as a modification that allows for a multi-year ROI calculation. If you need to calculate the ROI for your project options or investment alternatives, use our free calculator in this article.
- What Is the Return of Investment (ROI)?
- How Is the Return on Investment Calculated?
- The ROI Calculator – Calculate the Return on Investment (Basic Concept)
- Examples of Basic and Multiple Years ROI
- What Are the Advantages and Disadvantages of the ROI?
- Alternative Measures
- Conclusion
What Is the Return of Investment (ROI)?
The return on investment is an indicator of the profitability of an investment or a project. As the ROI is a percentage value, it can be used to compare different projects and investment alternatives with respect to their profitability.
The result is a ratio of benefits and returns in relation to investment and costs. This helps compare alternatives with different investment amounts where absolute returns would not be an appropriate measure for comparison purposes.
What Is Return on Investment for Multiple Years?
Returns may occur at different points in time for different alternatives. It does make a difference whether you are receiving a return at an early or late point in your projection.
Therefore, there is a specific formula for returns that are earned over multiple periods or years. It helps you compare the ROIs of investment alternatives with a different tenor or different cash flow characteristics (source).
How Is the Return on Investment Calculated?
The Basic ROI Formula
In its most simple form, the ROI is calculated by dividing the returns after cost by the investment:
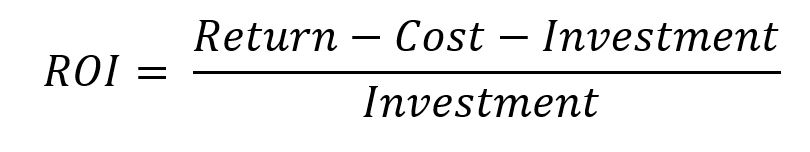
This formula may be applied to single-period projects and investments (e.g. a project delivered within one year, a bond with a 1-year maturity). In practice, it is also used for multiple periods which however may not be accurate as the value of time may not be sufficiently considered. If this aspect is not deemed material, investment and project alternatives can be compared using a basic ROI as long as it relates to a small number of periods and the tenors of all alternatives are identical. However, this is not as accurate as the multi-period ROI that is introduced below.
How Is the Return on Investment Calculated for Multiple Return Periods?
If you are comparing project options and investment alternatives with different tenors, you achieve more accurate results when you are using the ROI formula for multiple years instead of the basic ROI concept. You will then be able to compare the annualized ROI of the different alternatives.
The ROI for multiple periods distributes the return earned at the end of the investment’s tenor across the periods. Thus, an investment with returns over 2 years can be compared with an investment for 4 years, for instance.
The Multi-Year ROI Formula
The Return on Investment formula is as follows:
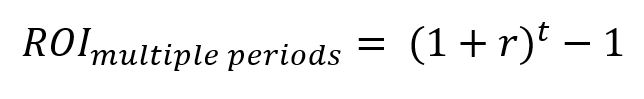
where:
ROI [multiple periods] = cumulative return over all periods
r = return per period [in %] (the equation needs to be solved for r)
t = number of periods
The first component of this formula is similar to the future value formula (FV = (1+r)^t) solved for r as the periodic (e.g. annualized) return. Subsequently, r (in %) is the relevant measure to compare different alternatives.
Calculation in Excel
In Excel, the multi-period ROI can be determined by using the RATE Function. It requires the parameters
- nper: the number of periods,
- pmt: payments, this parameter can remain empty for the purpose of this calculation,
- present value: to be populated with the investment amount (negative figure, representing an initial cash outflow),
- future value: the total return (incl. amortization of the initial investment) at the end of the time horizon,
- type (of cash flow): select whether cash flows occur at the end (the typical case) or beginning of a period,
- guess: an estimation of the rate, if available (can be empty).
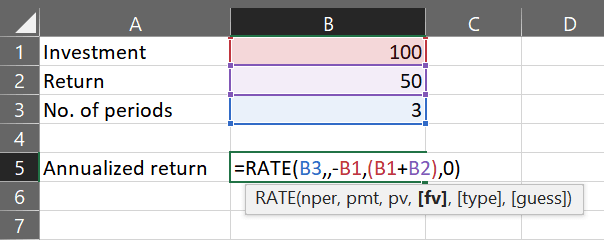
The result is the annualized return in percent which however is not as accurate as the internal rate of return method if cash flows occur between the first and last periods.
Disadvantages and Modifications of this Method
This approach assumes that all returns occur in the form of a single cumulative inflow in the last period of the investment’s tenor. This is appropriate for compounded investments, e.g. a bond that accumulates yields over time which are paid at maturity.
However, other investments and types of projects may produce returns before the end of the projection. These returns would have to be accumulated to apply the above formula. This is often done in a rough way by using the sum of these returns as a total return in the last period. This approach does not take the value of time into account – note that a return in an earlier period is usually more valuable than one in a later period – and is therefore not recommended.
Calculating and considering the sum of the future values of each and every return at the end of the investment tenor is the more accurate alternative method. However, this requires further assumptions (i.e. the interest rate) and additional calculation efforts. Another more accurate technique is the internal rate of return (IRR) method.
Considerations when Calculating the Return on Investment
What Are the Types of Returns Considered for ROI?
All kinds of returns in the form of yields, benefits and inflows are basically taken into account when calculating the ROI.
For financial investments, this may include for instance:
- interests,
- dividend payments,
- capital gains,
- other positive financial inflows or gains.
The definition of returns in project management is not that straightforward though. The benefits of projects are often more complex than those of plain-vanilla financial instruments. They may consist of both qualitative and monetary benefits – examples are:
- increased or newly produced earnings or revenue,
- cash inflows,
- cost savings due to efficiency gains implemented by a project,
- appreciations of assets,
- qualitative benefits converted into monetary equivalents.
If you are performing a cost-benefit analysis in the context of a project, you will want to be transparent (and seek stakeholders’ approval, if necessary) on the scope of benefits considered for your ROI assessment. You might also check existing requirements for profitability analyses and business case evaluations within the organization you are working for.
The same recommendation holds true for the question of whether taxes are to be taken into account. While some organizations and investors prefer including tax effects into an ROI calculation, others may separate those aspects to reduce complexity or allow for a more holistic assessment of tax effects.
Whichever scope of returns you are defining and using, make sure you are applying these criteria to all options you are comparing. This is to ensure a level playing field among the alternatives and ensure the comparability of your results.
What Are the Types of Cost and Investment Considered for ROI?
Similar to the considerations for the scope of returns, you will have to define the investment and cost that you include in your evaluation. For financial investments, you are probably able to determine the costs of incurring and managing an investment, besides the initial investment amount.
In projects, there is usually a distinction in different types of costs. Most fundamental is the decision on how direct and indirect costs are treated. Certain costs may be part of the investment – e.g. cost of resources used in a project – while other types such as operating cost of an asset might not be defined as part of the investment.
While this does not necessarily change the return amount which is a net return anyway, it will affect the denominator. The more cost types you include in your total investment amount, the lower the ROI value. When you compare different alternatives, you should therefore allocate cost types in a consistent manner and be aware of the effects it may have depending on the characteristics of the alternatives.
The ROI Calculator – Calculate the Return on Investment (Basic Concept)
Fill in the expected returns and the calculated investment. For the assumptions and components that need to be considered, refer to the previous section. The calculator will determine the basic ROI which can be used for single-period tenors or investment alternatives with an identical timeline.
Examples of Basic and Multiple Years ROI
Example 1) Investment with a Single Return at Maturity
In this example, a company is comparing 3 investment alternatives with different characteristics and returns. All three alternatives require an initial investment in year 0 (negative cash flow) and come with a single payment at maturity that consists of the repayment and the return.
The expected investments and repayments are as follows:
| Investment and Return Projection | now | Year 1 | Year 2 | Year 3 |
| Alternative 1 | -10000 | 13000 | ||
| Alternative 2 | -12000 | 11000 | ||
| Alternative 3 | -15000 | 17000 |
A calculation of the basic Return on Investment and the multi-year ROI leads to the following results:
| Calculation & Results | Alternative 1 | Alternative 2 | Alternative 3 |
| Investment | -10000 | -12000 | -15000 |
| Net returns | 3000 | -1000 | 2000 |
| Basic ROI | ROI = 3000 / 10000 = 30.00% | ROI = -1000 / 12000 = -8.33% | ROI = 2000 / 15000 = 13.33% |
| Annualized return r | r = 9.14% | r = -2.86% | r = 13.33% (identical to basic ROI as tenor = 1 year) |
| Calculation of annualized return | ROI(3y) = (1 + 9.14%) ^ 3 – 1) = 30.00% | ROI(3y) = (1 + -2.86%) ^ 3 – 1) = -8.33% | ROI(1y) = (1 + 13.33%) ^ 1 – 1) = 13.33% |
The alternatives 1 and 2 are both repaid in period 3. Thus, the basic ROI would be sufficient to compare these two alternatives. Alternative 1 with a total return of 30% is more beneficial (without prejudice to other decision criteria) than alternative 2 that produces a negative return (i.e. a loss) of 8.33%.
If alternative 3 is included in the comparison, the multiple-period ROI needs to be used to consider the different tenors. Using the annualized return as the only criterion, alternative 3 would be the most profitable investment (with 13.33% annualized return compared to 9.14% and -2.86% for alternatives 1 and 2, respectively).
Example 2) Use of Single- and Multi-Period ROI to Compare Project Options
In this example, three project options are compared with each other. These numbers have been used for other investment evaluation approaches as well – refer to our cost-benefit analysis overview to learn more details as well as the results of other methods.
Cash Flow Projections
The cash flow projections and classification of investment and operational cost is as follows:
| Option 1 | Now | Year 1 | Year 2 | Year 3 | Year 4 | Year 5 | Year 6 |
| Investment and Cost (outflows) | -5000 | -5000 | -1000 | -500 | -500 | -1000 | -1000 |
| of which: investment | -5000 | -4000 | |||||
| of which: cost | 0 | -1000 | -1000 | -500 | -500 | -1000 | -1000 |
| Benefits and Earnings (inflows) | 0 | 0 | 3000 | 5000 | 5000 | 4000 | 4000 |
| Net Cash Flow | -5000 | -5000 | 2000 | 4500 | 4500 | 3000 | 3000 |
| Option 2 | Now | Year 1 | Year 2 | Year 3 | Year 4 | Year 5 | Year 6 |
| Investment and Cost (outflows) | -15000 | -1000 | -1000 | -1000 | -500 | -500 | -1000 |
| of which: investment | -15000 | ||||||
| of which: cost | 0 | -1000 | -1000 | -1000 | -500 | -500 | -1000 |
| Benefits and Earnings (inflows) | 0 | 2500 | 5000 | 5000 | 5000 | 5000 | 5000 |
| Net Cash Flow | -15000 | 1500 | 4000 | 4000 | 4500 | 4500 | 4000 |
| Option 3 | Now | Year 1 | Year 2 | Year 3 | Year 4 | Year 5 | Year 6 |
| Investment and Cost (outflows) | -3000 | -3000 | -2500 | -1000 | -500 | -500 | -500 |
| of which: investment | -3000 | -2500 | -2000 | -500 | |||
| of which: cost | 0 | -500 | -500 | -500 | -500 | -500 | -500 |
| Benefits and Earnings (inflows) | 0 | 0 | 3000 | 4000 | 4000 | 3000 | 3000 |
| Net Cash Flow | -3000 | -3000 | 500 | 3000 | 3500 | 2500 | 2500 |
ROI Calculation for these Examples
The ROI calculation and the resulting ROIs for these examples are summarized in the following table:
| Calculation and Results | Option 1 | Option 2 | Option 3 |
| Total Investment | -9000 | -15000 | -8000 |
| Total net returns | 7000 | 7500 | 6000 |
| Basic ROI | ROI = 7000 / 9000 = 77.78% | ROI = 7500 / 15000 = 50.00% | ROI = 6000 / 8000 = 75.00% |
| Annualized return ROI (r) | r = 10.06% | r = 6.99% | r = 9.78% |
| Calculation of annualized ROI | (1 + r) ^ 6 – 1 = 77.78% | (1 + r) ^ 6 – 1 = 50.00% | (1 + r) ^ 6 – 1 = 75.00% |
| Check | ROI(6y) = (1 + 10.06%) ^ 6 – 1) = 77.78% | ROI(6y) = (1 + 6.99%) ^ 6 – 1) = 50.00% | ROI(6y) = (1 + 9.78%) ^ 6 – 1) = 75.00% |
Interpretation of Results
Comparing the ROIs of the 3 project options reveals a minor advantage of option 1 over option 3 while option 2 looks much less appealing. As the projections of all options have a time horizon of 6 years, a ranking based on the annualized return would lead to the same result (unless returns were compounded).
Considering the characteristics of the 3 cash flow projections, the use of the ROI methods for this example is not ideal. Inflows and outflows differ significantly among the options and periods. Thus, an assessment based on a more accurate method (see “alternative methods” section below) is more appropriate.
What Are the Advantages and Disadvantages of the ROI?
While the return on investment is a popular and widespread measure, it comes with a number of pros and cons described below. As important as the fundamental advantages and disadvantages of this technique is the way the ROI is used in your analysis. MIT Sloan Review points out that the “biggest challenge with ROI isn’t a technical deficiency but confusion over how it is used“ (source).
Pros
- Ideal for investments with a single return,
- common easy to understand success measure,
- makes options with different investment amounts comparable,
- the modified formula can be used for multi-year returns.
Cons
- ROI calculation may require several assumptions and definitions, e.g. scope of returns, cost, and investment,
- these assumptions may have a strong impact on the results,
- inaccurate results if returns occur at different periods,
- basic approach not suitable for multi-year investments and endeavors,
- qualitative returns need to be converted into monetary values (which requires further assumptions).
Alternative Measures
For use in project management, there are various alternatives to an ROI. These include payback period, benefit-cost ratio, net present value and internal rate of return. Each of these success measures comes with its respective advantages and disadvantages.
Read our overview of cost-benefit analysis methods to get a full comparison of these approaches:
Conclusion
Return on Investment is a common indicator to measure the profitability of investments and projects, While it can help achieve comparability of different alternatives, it requires some assumptions that may impact the results significantly. Being transparent and applying them in a consistent manner is key to ensure the comparability of the results across different options.
If you are working on a cost-benefit analysis, you should try not to rely on the results of only one success measure. Read more about the various methods to evaluate different project options and use a set of measures that fits best for your assessment.