
An important part of project management concerns the forecasting and management of cost. In fact, this is often one of the most prominent topics in project status reports and discussions with project sponsors and stakeholders, given the importance of budget constraints. Schedule Performance Index (SPI) and Cost Performance Index (CPI) are useful and comparatively simple techniques to help manage a project.
In this article, we will introduce and define both measures, including their respective formulas. If you like to calculate the indicators, use our CPI & SPI calculator. If you are preparing for your PMP exam, be aware that you will likely be asked questions about CPI and SPI, their calculation and interpretation. Therefore, you will find our examples particularly useful for your exam preparation.
Fundamentals of Project Cost Measurements
Project Cost Management is an element of the Project Management methodology defined by the Project Management Institute. The measures discussed in this article are set out in the Earned Value Analysis (EVA) technique, introduced in the Project Management Body of Knowledge (source: PMBOK®, 6th ed., ch. 7.4.2.2 Data Analysis, p. 261)
The input parameters are planned value, earned value and actual cost. These indicators are often calculated in monetary units (e.g. USD) or work-time units (e.g. man-days).
Planned Value (PV)
The term planned value refers to the budget (before management reserve) that has been allocated to a project or a part of a project, e.g. a phase or an activity. It is usually determined by estimating activities or elements of the Work Breakdown Structure.
Earned Value (EV)
Earned value measures the materialized progress of a project. It relates to the part of the budget allocated to work that has been performed and completed. By definition, it cannot exceed the planned value, i.e. additionally performed work that has not been authorized and planned in the planned value cannot be accounted for in the earned value calculation.
Actual Cost (AC)
Actual cost is the amount of cost that has been realized for the authorized work performed (hence, cost for additional work that has not been considered for the budget cannot be included). For accurate and meaningful results, it is important to define a single cost base for the budget and the actual cost (e.g. whether direct cost or full cost are used).
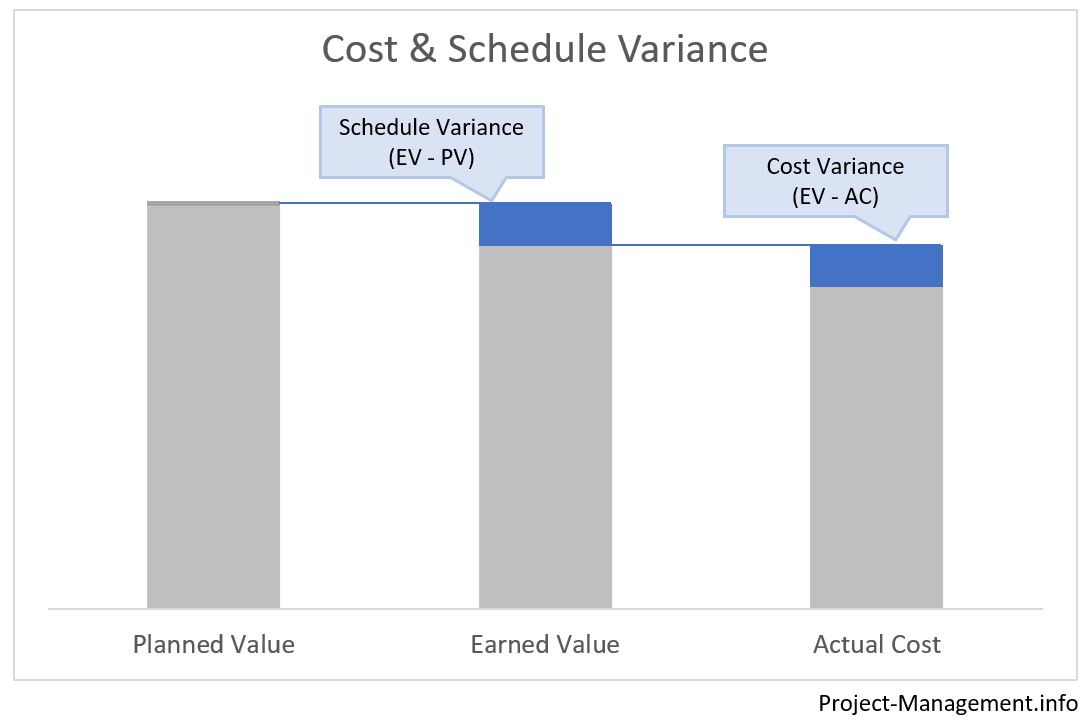
Variance Analysis for Cost and Schedule
What Is the Cost Variance (CV)?
The cost variance is part of the variance analysis techniques. It compares the actual costs with the earned value. It can also be used to calculate a forecast of the development of cost and future budget implications of a project.
Formula for Cost Variance Calculation
The cost variance is calculated as the difference between earned value and actual cost:
CV = EV – AC
A negative amount indicates that the cost incurred to achieve the amount of work performed was higher than planned / budgeted.
What Is the Schedule Variance (SV)?
The schedule variance follows the same principle, however, it compares the earned value with the planned value. It is also an input for the projection of the future schedule performance in relation to the planned work and budget of a project.
Formula for Schedule Variance Calculation
The schedule variance is the difference between earned value and planned value:
SV = EV – PV
If the SV is negative, the project is behind schedule, e.g. the actually earned value at a given point in time or cumulated over a period is lower than the planned value at the respective point.
What Is the Cost Performance Index (CPI)?
The cost performance index is a component of the variance analysis techniques which are, according to PMI methodology, part of the “control cost” process of a project. The CPI is used to compare costs and earned value at a point of time or cumulated over several periods of a project.
How Is the Cost Performance Index Calculated?
As the cost variance calculation, the cost performance index requires the input parameters
- Earned value (EV)
- Actual cost (AC)
The cost performance index is calculated using the following formula:
CPI = EV / AC
How Is the CPI Interpreted?
The CPI is a different way of presenting the cost variance. Being calculated as a ratio rather than an absolute variance, its result indicates the relative scale of deviations which helps asses their criticality. The CPI is also used to project cost incurrence for the future periods of a project, e.g. in the context of re-estimation of budgets.
Its results indicate:
- If CPI = 1, the cost and performance are in line with the plan
- If CPI < 1, the project has a cost overrun compared to the plan
- If CPI > 1, the project has incurred less cost than planned
What Is the Schedule Performance Index (SPI)?
The schedule performance index, too, belongs to the variance analysis techniques. It measures the progress of a project compared to the planned schedule. The SPI can be calculated for a particular period but also cumulative for all a number of periods of a project or the entire project.
How Is the Schedule Performance Index Calculated?
The schedule performance index is calculated with the same input values as the schedule variance, namely:
- Earned value (EV)
- Planned value (PV)
The schedule performance index formula is:
SPI = EV / PV
How to Interpret the SPI?
One of the advantages of the SPI is the handy presentation of the progress compared to the plan as well as its use for projections of the future progress.
Its value ranges are interpreted as follows:
- If the SPI = 1, the project is on schedule
- If the SPI < 1, the project is behind schedule (in other words: the EV is lower than the PV)
- If the SPI > 1, the project is ahead of schedule
Although CPI and SPI follow a similar concept, their results can be fundamentally different for the same project (phase): A project might be ahead of schedule (i.e. EV exceeds PV, hence SPI > 1) but, at the same time, have a cost overrun (i.e. AC higher than EV, hence CPI < 1).
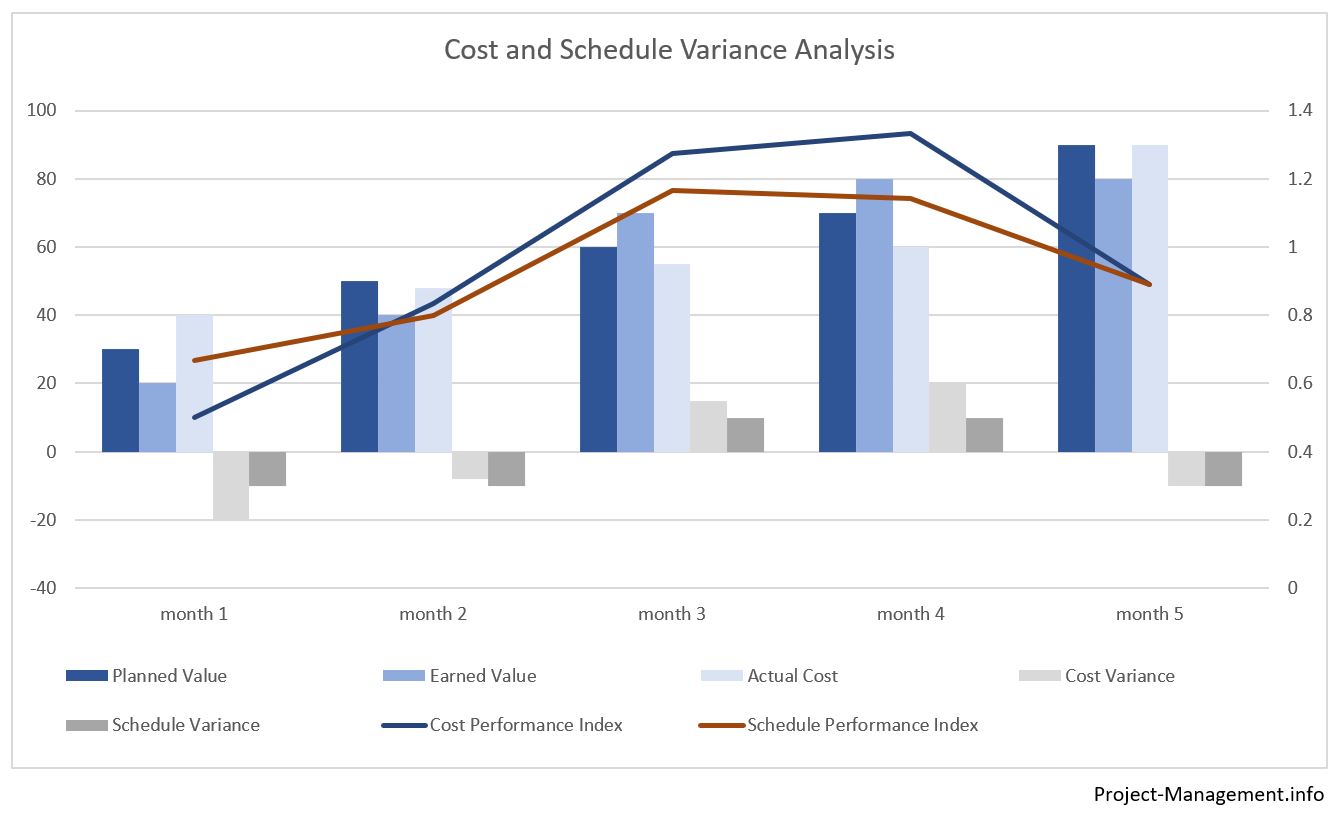
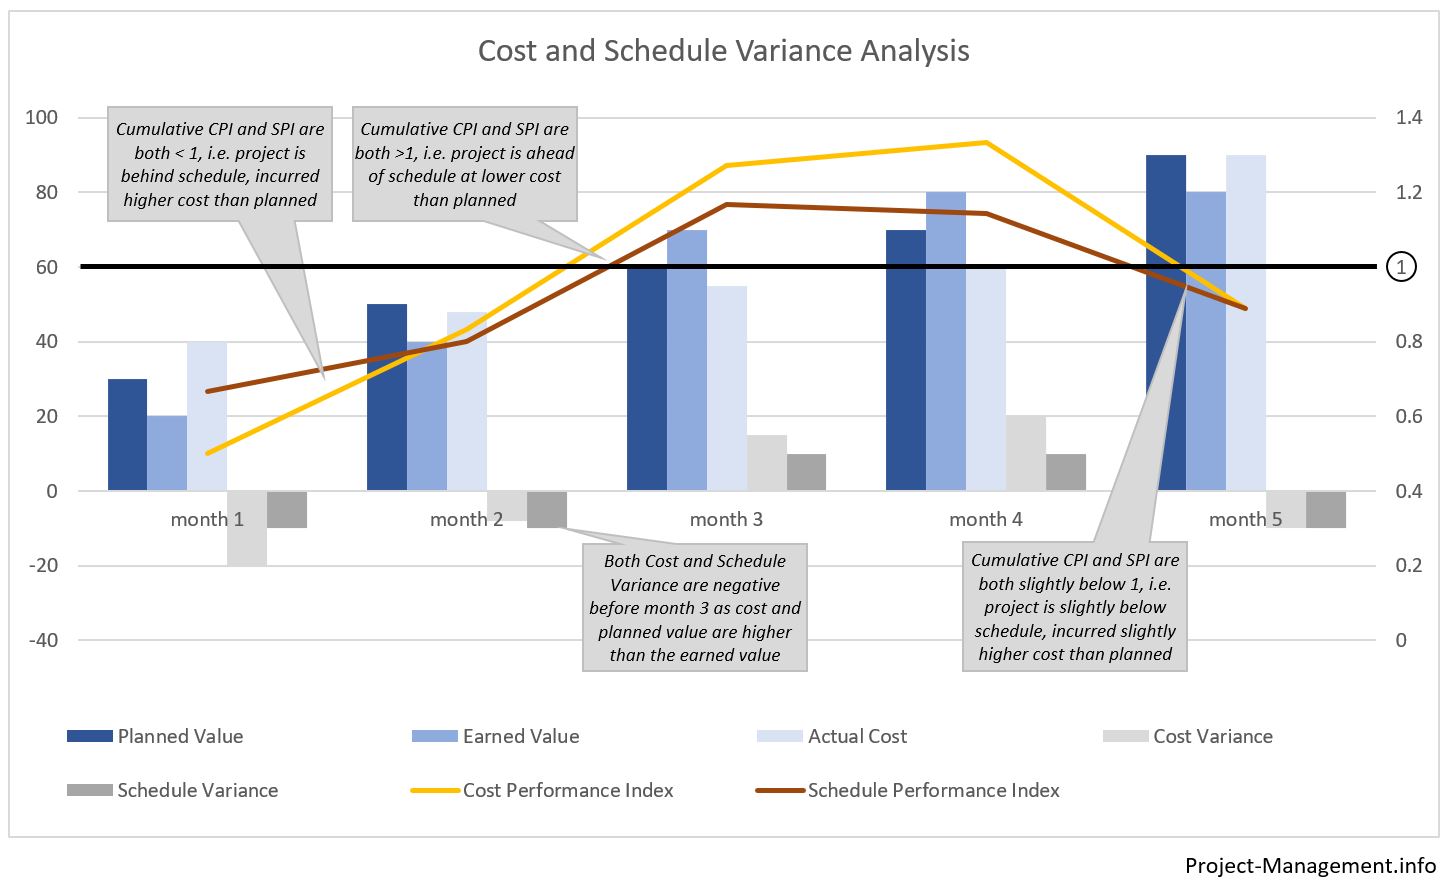
Examples Calculation and Use of CV, SV, CPI and SPI
The following figure contains some explanations on the example diagram shown above. It shows the cumulative planned value, earned value and actual cost (the blue bars), the schedule and cost variance (the grey bars) and the development of the cost performance index and schedule performance index over time. All numbers are cumulative, e.g. the input measures (PV, EV, AC) are the sum of the amounts accumulated over the current and previous periods.
Example 1: A Simple Calculation of Cost and Schedule Performance Indexes
Let’s start with a simple example first.
Situation
The books and records of your PMO show the following numbers:
| Cumulative | |
| Planned Value | 200 |
| Earned Value | 190 |
| Actual Cost | 220 |
Cost and Schedule Variances
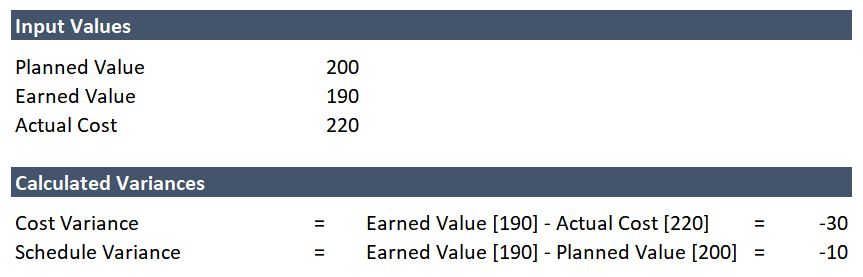
Both the cost and the schedule variance are negative, i.e. the cost and the planned value are higher than the actually earned value.
Cost and Schedule Performance Indexes
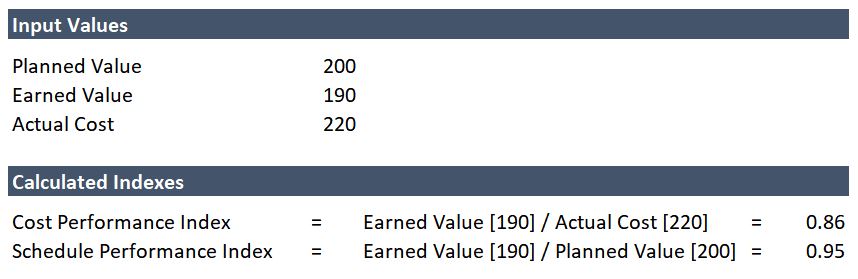
This example illustrates the beauty of the indexes: the absolute numbers of the cost variance do not immediately show impact of variances in relation to the plan. The cost performance index and schedule performance index, on the other hand, indicate the intensity of the deviation. The cost performance index value of 0.86 in this example may require corrective actions in most circumstances. A schedule performance index value of 0.95 may be acceptable or tolerated in some projects (e.g. if buffers or ‘nice-to-have’ work were planned) or phases (e.g. early stages) and might not require immediate action.
Example 2: Case Study of a Project in a Turnaround Situation
Let’s look at an example of how these metrics are used in practice:
A project has been going on for 3 months. The project manager feels that it has not started too well as he notes less earned value than planned at higher cost than expected. However, she thinks that the performance improved significantly and wants to share a positive outlook with the stakeholders.
How can she prove this perception, using the earned value analysis technique?
Situation
The project’s records of budget, plan and cost show the following numbers (per period, not cumulated):
| Month 1 | Month 2 | Month 3 | Cumulative | |
| Planned Value | 100 | 130 | 200 | 430 |
| Earned Value | 60 | 120 | 220 | 400 |
| Actual Cost | 90 | 150 | 200 | 440 |
The project is planned for a duration of 1 year with a total budget of 2,500.
Cost and Schedule Variances and Indexes
There are two sets of variances that are sensible to calculate here: the cumulative variances which are negative, and those for each month.
Let’s start with the cumulative variance. The formulas are CV = EV – AC and SV = EV – PV, hence
- CV = 400 – 440 = -40
- SV = 400 – 430 = -30
All in all, these numbers do not look too encouraging, given the negative variances and index values significantly below 1.
However, the picture changes when we switch from a cumulative to a month-by-month view:
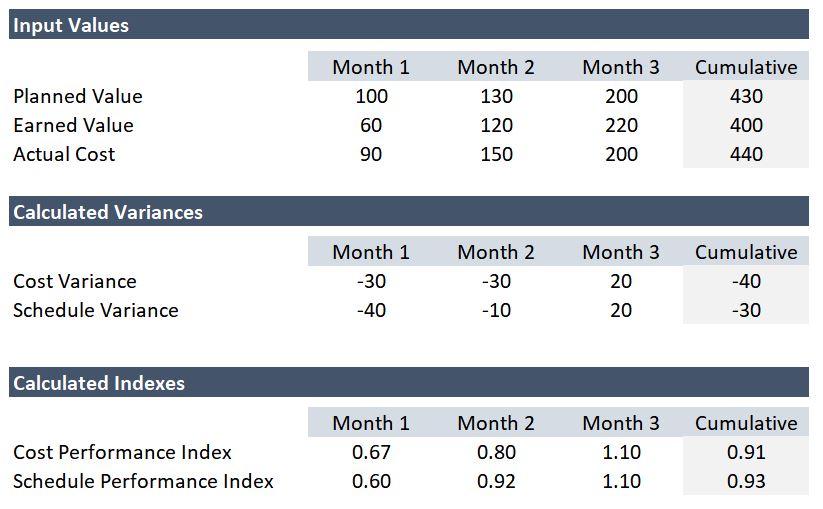
As you see, the variances changed from SV (m1) = -40 and CV (m1) = -30 in the first month to SV (m3) = +20 and CV (m3) = +20 in the third month, with both SPI and CPI above 1.
The numbers in month 3 look quite positive though as the cost overrun has been stopped and the earned value is even exceeding the planned value in that month. These numbers do actually support the project manager’s view (assuming the positive development of EV and AC are sustainable).
Takeaway Points
The cost variance (CV) and schedule variance (SV) indicate the deviation from the project plan and budget in absolute numbers, usually currency units or time-effort units such as man-days. The cost performance index and schedule performance index set these values in relation to the project plan and indicate the relative impact. If CPI or SPI are consistently and significantly higher or lower than 1, it may indicate that a re-planning of the project might be appropriate.
There is however some criticism to these indicators: It can be argued that the generic CV/SV/CPI/SPI techniques value performance (earned value) based on input parameters (consumed budget or man-days) rather than reflecting the business value. For instance, if one deliverable is budgeted at 100 md and generates a benefit of 1000 USD for an organization while another 100-md deliverable produces only 800 USD business value both will nevertheless be considered with a Planned Value (and Earned Value upon completion) of 100 md. Therefore, there are some modified approaches in use which may balance these deficiencies but increase complexity.
All in all, the generic CV, SV, CPI and SPI are well-established measures as they are illustrative and meaningful while, at the same time, comparatively easy to calculate and understand. They are also used for the forecasting of estimates at completion (EAC). Last but not least, these measures are a part of the PMI methodology, a global standard of project management, and also included in certification exams such as PMP or PMI-ACP.