
When you need to schedule the activities of a project you might want to consider using a project schedule network diagram. This is a proven technique for determining and documenting the sequence of activities taking interdependencies among them into account. It is also suggested by the Project Management Institute’s framework (PMBOK® Guide, 6th ed., ch. 6.3.3.1).
What Is a Project Schedule Network Diagram?
A project schedule network diagram is an output type of the process ‘sequencing activities’ according to PMI’s Guide to the Project Management Body of Knowledge (PMBOK®, 6th ed., ch. 6.3.3).
Project schedule network diagrams show the order in which activities should be scheduled to address logical relationships between these activities.
It typically comprises of nodes that represent activities and arrows that show the sequence and dependencies. This way of presentation is also referred to as ‘activities on nodes’ (AON) diagramming. It is probably the most common type of project schedule network diagram.
An alternative form of presentation is the ‘activities on arrows’ (AOA) method where, as the name indicates, activities are shown as arrows while nodes represent the logical relationships.
A technique to create project schedule network diagrams is the precedence diagramming method which we are explaining in this article (incl. example).
Logical Relationships
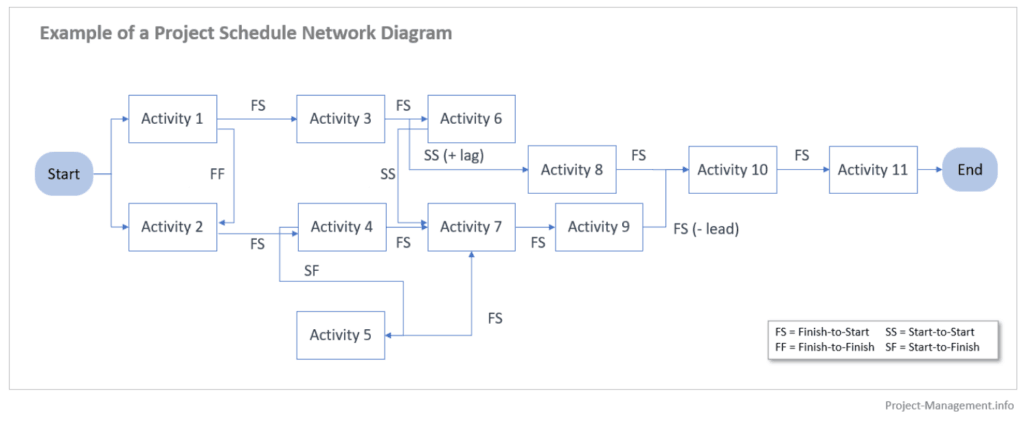
The diagram is based on and often enriched with information about the type of logical relationship between activities. The 4 types of dependencies are
- Finish to finish (FF),
- Finish to start (FS),
- Start to start (SS), and
- Start to finish (SF).
The first part of these terms indicates the status the predecessor activity must obtain before the successor activity can have the status referred to in the second part. In a finish to start dependency, for instance, the predecessor must have finished for the successor to start. Read more, incl. examples, in this introduction to the predecessor diagramming method.
Apart from dependencies, a project schedule diagram can also show leads and lags. These are characteristics of the timing and scheduling of activities that we are explaining in detail in this article.
What Is A Project Network Diagram Used for?
A project network diagram is used to develop and document the sequence of activities. It belongs to the ‘project schedule management’ knowledge area where it is served as an input for other scheduling techniques, such as the schedule network analysis or the critical path method (PMBOK®, ch. 6.5.2.1).
In a project, you can also use this type of diagram to discuss sequences and dependencies, as well as for the stakeholder communication. In larger projects, however, it is often a rather detailed and complex working document that links the dependencies and sequences of all activities to the overall project schedule and duration. For the communication of the project schedule, other ways of presentation (such as Gantt diagrams) and a more aggregated view tend to be more common than schedule network documents in many organizations.
Schedule network diagrams are also used to document the slacks and floats and the leads and lags of activities. They are the basis to identify the critical path, i.e. the chain of activities with the longest duration.
How Do You Create a Schedule Network Diagram?
Relevant inputs of the schedule network diagram are the list of defined activities, the estimated durations of these activities and the logical relationships among them (also referred to as dependencies).
To draw a schedule network diagram (in line with the AON method), you will need to
- Draw a starting point,
- Insert activities on the (future) nodes of your diagram, including details and additional data (see explanation below),
- Connect the activities with arrows that represent the type of logical relationships (as explained in our article on the precedence diagramming method),
- Add details to each relationship, such as the type of dependency (e.g. SS, FS), whether it is required or discretionary, leads and lags, as well as other data relevant for your scheduling, and
- Create an endpoint of the diagram.
You will find an example in the next section.
Details that are often added to the activities include the earliest start and latest finish date, the criticality of an activity as well as references to work packages or the work breakdown structure. Waiting time for activities, referred to as slack or float, can also be included.
If you prefer the activities-on-arrows (AOA) method to develop your schedule network diagram, you draw activities as arrows and dependencies as nodes.
In projects that use scheduling software to support the project management, such diagrams are usually created by the software. However, the input data requirements, i.e. the list of activities, logical relationships and leads and lags, are the same and need to be provided by the user. The software is then able to draw the diagram and determine the optimal sequence of activities.
If you do not have the right software at hand or if you work in smaller, less complex projects, you can also use standard office software such as Visio or PowerPoint (which we have used to create the example diagram below) to create the diagram manually.
Example of a Schedule Network Diagram
In this section, we are going to introduce a (simplified) set of activities that need to be sequenced and documented in a project schedule network diagram. A part of this case study is also used in our example of the precedence diagramming method. You will find it in our PDM article together with more details on how we have identified and categorized the logical relationships among these activities.
This example is about an IT development and implementation project. However, the creation and use of a schedule network diagram are similar for all kinds of projects irrespective of their subject matter.
Activities and Logical Relationships
The project comprises of the phases
- designing,
- developing,
- implementing,
- testing and
- deploying the software.
The activities are as follows:
- technical design of module A (duration: 10 days),
- technical design of module B (duration: 5 days),
- development of module A (duration: 15 days),
- development of module B (duration: 20 days),
- development of feature F in module B (duration: 1 day),
- implementation of module A (duration: 5 days),
- implementation of module B (duration: 7 days),
- testing of module A (duration: 6 days),
- testing of module B (duration: 10 days),
- integration testing (duration: 5 days),
- Deployment (duration: 1 day).
The first 5 activities have logical relationships of FF, FS, SS and SF. Check this example in our PDM article to learn how we have identified these dependency types.
In addition to those logical relationships, there are leads and lags in this sequence of activities:
- The testing of module A can start 4 days after the implementation of that module has started, hence it is a SS dependency with 4 days lag time.
- The integration test is basically scheduled to start after the testing of the modules (FS relationship). However, this is not hard logic: integration tests can already begin once the testing of module B is 80% completed. The successor has therefore a lead time of 2 days.
If you are not yet familiar with this technique, read this introduction to lags and leads that also comes with an illustrated example.
Creating and Understanding the Project Schedule Network Diagram
Transferring this into a project schedule network diagram leads to the following result:
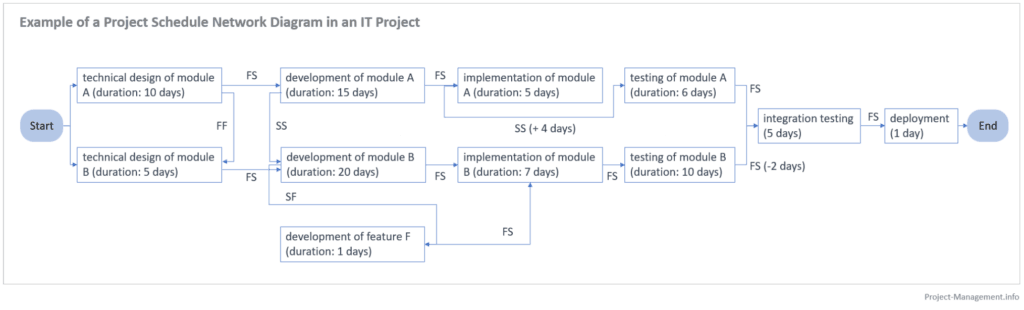
To create such a diagram, the first step is to identify the logical relationships among these activities. These relationship types define the sequence of activities and they are represented by arrows in this diagram. For a better understandability, it is not uncommon to write the respective dependency type next to the arrows.
In the simplest case of dependency, i.e. the finish-to-start relationship, the predecessor activity must finish first before the successor can start. This is represented in the diagram by drawing an arrow from the predecessor to the successor activity. In our example, this has been done e.g. for the technical design and the development of module A in the above diagram.
The lag of the activity ‘testing of module A’ (lag time 4 days) is shown as a positive number, as it extends the overall duration of that path of activities.
The lead of the ‘integration testing’ activity is shown with a negative number for the opposite reason.
Implications for Project Schedule Management
You can follow the arrows along each sequence of activities and add the durations as well as the lead and lag times to determine the duration of a path. The path of module A, from its design to its deployment, consists of the following activities:
- technical design of module A (duration: 10 days),
- development of module A (duration: 15 days),
- implementation of module A (duration: 5 days),
- testing of module A (duration: 6 days),
- integration testing (duration: 5 days),
- Deployment (duration: 1 day).
The total duration of that particular path, if it were a project on its own, would be 44 days (10 + 15 + 5 + 4 + 4 [for testing: it takes 6 days, however, due to the SS relationship and lag of 4 days, 2 days of the testing duration are performed in parallel to the implementation. Thus, only 4 days of additional time are needed, hence 4 days added to this path] + 5 + 1).
However, this is not the correct duration of our sample project!
The path of module B takes a longer time to arrive at the point ‘testing of module B 80% finished’ (45 days), which is the condition for the integration test to start. As it takes a minimum of only 34 days for the path of module A to finish its predecessor activity of the integration test (i.e. testing of module A), this path would need to “wait” for the path of module A to finish its module testing. This “waiting time” is also called slack or float.
Conclusion
A schedule network diagram is a useful visualization of the sequence and logical relationships of activities in a project. If you follow the arrows and take the types of relationships as well as the leads and lags into account, you can determine the duration of a path and, eventually, identify the critical path of a project.
Although the sequencing of activities is often done by project management software nowadays, it is crucial to understand the dependencies between activities and their impact on the sequencing and project schedule. This is important for the PMP exam, as there are usually a few questions on scheduling, as well as for the development of project schedules in practice.
Read more about scheduling techniques in our dedicated section.