
The discounted payback period (DPP) is a success measure of investments and projects. Although it is not explicitly mentioned in the Project Management Body of Knowledge (PMBOK) it has practical relevance in many projects as an enhanced version of the payback period (PBP).
Read through for the definition and formula of the DPP, 2 examples as well as a discounted payback period calculator.
What Is the Discounted Payback Period (DPP)?
The discounted payback period is a measure of how long it takes until the cumulated discounted net cash flows offset the initial investment in an asset or a project. In other words, DPP is used to calculate the period in which the initial investment is paid back.
In project management, this measure is often used as a part of a cost-benefit analysis, supplementing other profitability-focused indicators such as internal rate of return or return on investment. It can however also be leveraged to measure the success of an investment or project in hindsight and determine the point at which an initial investment has actually paid back.
The discounted payback period is calculated by discounting the net cash flows of each and every period and cumulating the discounted cash flows until the amount of the initial investment is met. You will find the formula in the next section. This requires the use of a discount rate which can be either a market interest rate or an expected return. Some organizations may also choose to apply an accounting interest rate or their weighted average cost of capital.
While the discounted payback period is still a comparatively handy indicator, it is more precise than the generic payback period as it considers the time of the occurrence of cash flows.
What Is the Difference between Payback Period and Discounted Payback Period?
The discounted payback period has a similar purpose as the payback period which is to determine how long it takes until an initial investment is amortized through the cash flows generated by this asset.
The difference between both indicators is that the discounted payback period takes the time value of money into account. This means that an earlier cash flow has a higher value than a later cash flow of the same amount (assuming a positive discount rate). The calculation therefore requires the discounting of the cash flows using an interest or discount rate.
The generic payback period, on the other hand, does not involve discounting. Thus, the value of a cash flow equals its notional value, regardless of whether it occurs in the 1st or in the 6th year. This may fit for the purpose of many high-level analyses. However, it tends to be imprecise in cases of long cash flow projection horizons or cash flows that increase significantly over time.
If the expected return rate of an investment is used as the discount rate to calculate the discounted payback period, both indicators can be applied in conjunction to determine different types of payback periods:
- The generic payback period indicates in which period the investment has amortized based on investments and cash flows at face value.
- The discounted payback period (using the expected return rate) indicates in which period both the initial investment and the expected returns have been earned.
How Is the Discounted Payback Period Calculated?
The formula to calculate the discounted payback period is:
DPP = y + abs(n) / p,
where
y = the period preceding the period in which the cumulative cash flow turns
positive,
p = discounted value of the cash flow of the period in which the cumulative
cash flow is => 0,
abs(n) = absolute value of the cumulative discounted cash flow in period y.
In order to calculate the DPP, create a table with a column for the periods, cash flows, discounted cash flows and cumulative discounted cash flows. Identify y, n and p and insert the numbers in the above-mentioned formula (source: Clayman, Fridson, Troughton: Corporate Finance: A Practical Approach). Alternatively, you can use the calculator embedded in this article.
Refer to the section below for an example of this calculation approach.
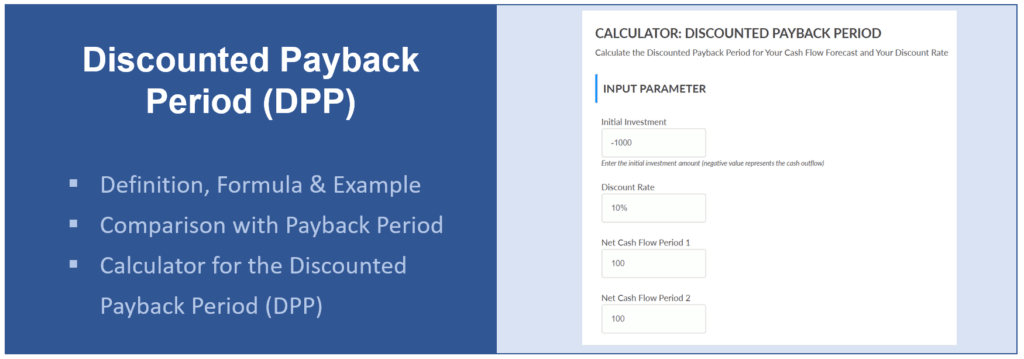
Calculator for the Discounted Payback Period
Use this calculator to determine the DPP of a series of cash flows of up to 6 periods. Insert the initial investment (as a negative number since it is an outflow), the discount rate and the positive or negative cash flows for periods 1 to 6. The Calculator is determining the DPP. The present value of each cash flow, as well as the cumulative discounted cash flows for each period, are shown for reference.
3 Examples of Applying the DPP
The numbers used in this example are stemming from the case study introduced in our project business case article where you will also find the results of the simple payback period method. In this analysis, 3 project alternatives are compared with each other, using the discounted payback period as one of the success measures.
Cash Flow Projections and DPP Calculation
The following tables contain the cash flow forecasts of each of these options. The discount rate was set at 12% and remains constant for all periods.
Project Option #1
| Year | – | 1 | 2 | 3 | 4 | 5 | 6 |
| Investment and Cost (outflows) | – 5,000 | -5,000 | -1,000 | – 500 | – 500 | -1,000 | -1,000 |
| Benefits and Earnings (inflows) | – | – | 3,000 | 5,000 | 5,000 | 4,000 | 4,000 |
| Net Cash Flow | – 5,000 | -5,000 | 2,000 | 4,500 | 4,500 | 3,000 | 3,000 |
| Discounting cash flow formula | -5000 / (1 + 12%) ^ 0 | -5000 / (1 + 12%) ^ 1 | 2000 / (1 + 12%) ^ 2 | 4500 / (1 + 12%) ^ 3 | 4500 / (1 + 12%) ^ 4 | 3000 / (1 + 12%) ^ 5 | 3000 / (1 + 12%) ^ 6 |
| Discounted net cash flow | – 5,000 | -4,464 | 1,594 | 3,203 | 2,860 | 1,702 | 1,520 |
| Cumulative discounted cash flows | – 5,000 | -9,464 | -7,870 | -4,667 | -1,807 | – 105 | 1,415 |
The relevant rows – the years, the discounted cash flows and the cumulative discounted cash flows are bolded in this table. To calculate the DPP, we need to search:
- y (the period preceding the period in which the cumulative cash flow turns positive) which is year 5 in this example;
- p (discounted value of the cash flow of the period in which the cumulative cash flow is => 0) = 1,520, the periodic discounted net cash flow of year 6;
- abs(n), the absolute value of the cumulative discounted cash flow in period y, which amounts to -105.
Inserting these numbers into the previously introduced formula [DPP = y + abs(n) / p] looks as follows:
Discounted Payback Period = 5 + abs(-105) / 1520 = 5.07.
Project Option #2
| Year | – | 1 | 2 | 3 | 4 | 5 | 6 |
| Investment and Cost (outflows) | – 15,000 | -1,000 | -1,000 | -1,000 | – 500 | – 500 | -1,000 |
| Benefits and Earnings (inflows) | – | 2,500 | 5,000 | 5,000 | 5,000 | 5,000 | 5,000 |
| Net Cash Flow | – 15,000 | 1,500 | 4,000 | 4,000 | 4,500 | 4,500 | 4,000 |
| Discounting cash flow formula | -15000 / (1 + 12%) ^ 0 | 1500 / (1 + 12%) ^ 1 | 4000 / (1 + 12%) ^ 2 | 4000 / (1 + 12%) ^ 3 | 4500 / (1 + 12%) ^ 4 | 4500 / (1 + 12%) ^ 5 | 4000 / (1 + 12%) ^ 6 |
| Discounted net cash flow | – 15,000 | 1,339 | 3,189 | 2,847 | 2,860 | 2,553 | 2,027 |
| Cumulative discounted cash flows | – 15,000 | -13,661 | -10,472 | -7,625 | -4,765 | -2,212 | – 185 |
In this example, the cumulative discounted cash flow does not turn positive at all. Therefore, a discounted payback period cannot be calculated. In other words, the investment will not be recovered within the time horizon of this projection.
Project Option #3
| Year | – | 1 | 2 | 3 | 4 | 5 | 6 |
| Investment and Cost (outflows) | – 3,000 | -3,000 | -2,500 | -1,000 | – 500 | – 500 | – 500 |
| Benefits and Earnings (inflows) | – | – | 3,000 | 4,000 | 4,000 | 3,000 | 3,000 |
| Net Cash Flow | – 3,000 | -3,000 | 500 | 3,000 | 3,500 | 2,500 | 2,500 |
| Discounting cash flow formula | -3000 / (1 + 12%) ^ 0 | -3000 / (1 + 12%) ^ 1 | 500 / (1 + 12%) ^ 2 | 3000 / (1 + 12%) ^ 3 | 3500 / (1 + 12%) ^ 4 | 2500 / (1 + 12%) ^ 5 | 2500 / (1 + 12%) ^ 6 |
| Discounted net cash flow | – 3,000 | -2,679 | 399 | 2,135 | 2,224 | 1,419 | 1,267 |
| Cumulative discounted cash flows | – 3,000 | -5,679 | -5,280 | -3,145 | – 920 | 498 | 1,765 |
The cumulated discounted cash flow becomes positive in period 5. The discounted payback period is calculated as follows:
Discounted Payback Period = 4 + abs(-920) / 1419 = 4.65
Interpretation of the Results
Option 1 has a discounted payback period of 5.07 years, option 3 of 4.65 years while with option 2, a recovery of the investment is not achieved.
If DPP were the only relevant indicator, option 3 would be the project alternative of choice. Using the payback period (without discounting cash flows) would lead to an identical ranking yet option 3 with a PBP of 4.71 years and option 1 with 4.77 years are much closer while in option 2, the investment would be recovered after 5.22 years.
In any case, the decision for a project option or an investment decision should not be based on a single type of indicator. You can find the full case study here where we have also calculated the other indicators (such as NPV, IRR and ROI) that are part of a holistic cost-benefit analysis.
Conclusion
The discounted payback period is a good alternative to the payback period if the time value of money or the expected rate of return needs to be considered.
The DPP can be used in a cost-benefit analysis as well as for the comparison of different project alternatives.